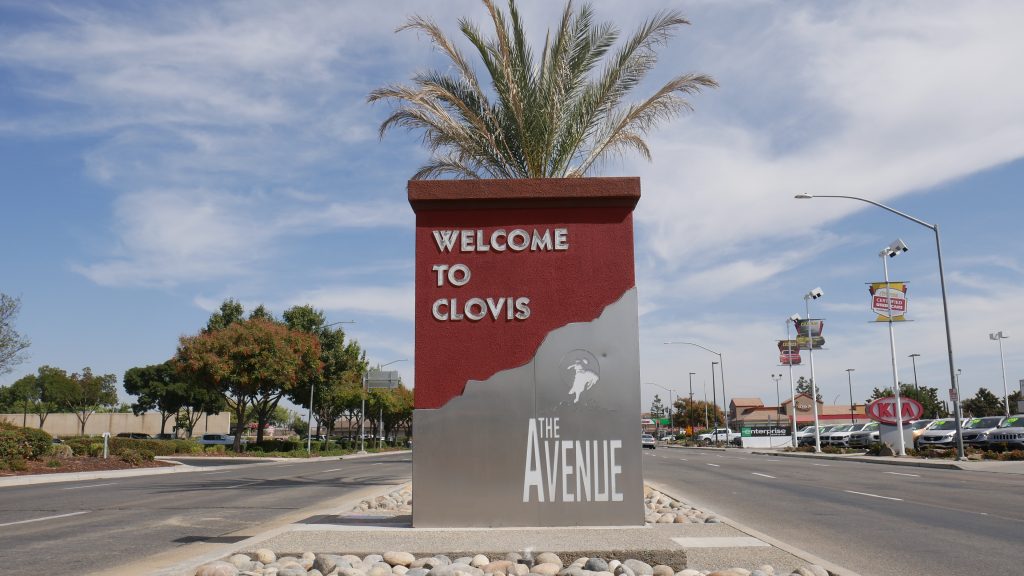
One of the best things about Clovis, many people say, is that it is unhindered by the traffic that clogs major coastal cities.
That’s slowly changing however. As Clovis grows, so does the amount of vehicles that travel its roadways. Clovis is no Los Angeles, but anyone who commutes down Shaw Avenue at 5 p.m. can attest that our streets are busier than ever before.
City planners need to keep track of increasing traffic in order to adjust accordingly in the future. That’s why the city employs engineers to collect traffic data and draw up plans to alleviate future traffic concerns.
The Roundup spoke to Colleen Vidinoff, an engineer with the City of Clovis, to learn more about Clovis’ increasing traffic and how the city addresses it.
Vidinoff said the three main methods the city uses to collect traffic data are road tubes, speed surveys and Geographic Information System (GIS) mapping.
Road tubes are small, rubbery tubes that are installed across roadways and collect data by detecting air pressure. When a car dives over one of the tubes, air pressure created from the tires striking the tubes are measured and collected. By using multiple tubes, engineers can measure the amount of traffic, its direction and its speed on any given street.
Vidinoff said the city deploys road tubes every three years to measure traffic.
“We do those on every road way,” she said. “We’ll put those out there for a week and get an idea of what the traffic count is on that street and its direction. That way we can see trends and we can see what adjustments need to be made.”
Another way the city measures traffic is through speed surveys.
Speed surveys are conducted every five years to collect data on prevailing speed and traffic. Not only do they help city engineers like Vidinoff collect traffic data, they are also used to determine California speed limits.
“This is actually how we set the speed limit of every stretch of roadway. We have to set the speed limit, per California, based on the 85th percentile of what the people are actually traveling,” Vidinoff said.
She continued, “We do those every five years on every single stretch of roadway. So we have it sorted out so we don’t have to do every street every single year. That way we get all of these done every five years and the tubes we put out every three years – that gives us the daily traffic and we get those mapped in GIS internally.”
The last way Clovis watches traffic is by using a GIS to map car accidents.
Vidinoff said using GIS mapping helps her to easily identify “problem areas.”
“You’d expect on an intersection one accident a month – that’s average – but if we look at it and it’s a little higher, we then ask ourselves what the ADT (Average Daily Traffic) is on it,” Vidinoff said. “So it depends on that and what intersection it is. Shaw and Willow is going to be a whole lot different than, say, a smaller intersection like Peach and Gettysburg or something like that.”
Based on the data collected from the three methods, Vidinoff and her fellow city engineers chose how to address current and future traffic concerns.
“All those things helps us keep track of trends and gives us an overall picture what there is in an area,” she said. “If there is a problem area and we see that ADT is increasing we might say we need more funding, and mapping it and keeping track of data helps us with funding, design and get an overview of what we need to do.”
The data is also invaluable to helping developers plan out their projects. That’s why Vidinoff said the city is working on making traffic data easier access to the public.
“Say a new business is coming in and thinking ‘Hey, what’s the ADT on this street? Is it worse of is it not?’ We’re trying to improve our communication and our coordination with that,” she said.
As traffic increases, the city invests in more funding to get better ways of collecting traffic data.
The city is currently looking into placing magnetic loop traffic detectors at major intersections, Vidinoff said.
“We have 15 intersections that use cameras. There are no magnetic loops in the ground – there are actually cameras,” she said. “The problem here is we get shadows and we get fog and these cameras don’t operate very well with that. If the sun is in the camera’s eyes it cant read it very well. We are in the process of getting those out and putting magnetic loops in the ground.”
Vidinoff said Clovis residents can help by reporting problems or concerns to the city’s customer relationship management system. The app, which is available on the app store and on the City of Clovis website, allows users to report problems with uploaded photos.
“It helps objectify issues, it helps us get it reported to the right person so we can address the issues,” Vidinoff said. “You can report anything from potholes and graffiti to signal problems. This way it helps us see what is going out in the real world on an ongoing basis.”


